What Is a Trading Signal?
A trading signal is any piece of data, indicator reading, or analytical output that suggests a potential trading opportunity in a financial market — a reason, rooted in analysis, to consider entering a long position, initiating a short position, closing an existing trade, or adjusting exposure.
At its most fundamental level, a trading signal answers one question: does current market evidence suggest this is a good time to act? The “evidence” can take many forms — a chart pattern completing, an economic data release beating expectations, a moving average crossing another, a positioning extreme in futures markets, or a news catalyst that shifts the fundamental outlook for an asset.
What a trading signal is not is a guarantee. No signal — regardless of how sophisticated its origin or how impressive its backtested win rate — can predict future price movement with certainty. Markets are probabilistic environments. A signal’s value lies in identifying conditions that have historically been associated with favorable outcomes more often than not — providing an edge that, applied consistently and with proper risk management over many trades, produces profitable results.
Understanding this distinction — between a signal as probabilistic input and a signal as definitive instruction — is the foundation of using signals effectively rather than recklessly.

How Trading Signals Work
Trading signals function by identifying specific conditions in market data that have historically preceded favorable price movements. The mechanism varies by signal type, but the underlying logic is consistent: if condition A is present, historical evidence suggests outcome B is more likely than not over the relevant time horizon.
The anatomy of a complete trading signal:
A well-formed trading signal is not just a directional cue (“buy gold”). A complete signal includes:
| Component | Description | Example |
| Instrument | What to trade | EUR/USD, S&P 500, Crude Oil |
| Direction | Buy (long) or Sell (short) | Buy |
| Entry Price / Zone | Where to enter the trade | 1.0850–1.0870 |
| Stop Loss | Where to exit if wrong | 1.081 |
| Take Profit Target(s) | Where to exit if right | 1.0950 / 1.1000 |
| Time Frame | The chart or analytical timeframe the signal is based on | 4-hour chart |
| Signal Basis | What generated the signal | Bullish engulfing at key support + RSI divergence |
| Risk-Reward Ratio | Potential gain vs. potential loss | 1:2.5 |
A signal missing these components — particularly the stop loss and take profit levels — is incomplete and potentially dangerous. Without predefined exit points, the trader has no framework for managing the trade and is left to make emotional decisions in real time, which is where most trading losses originate.
Types of Trading Signals
Trading signals are generated from four broad analytical frameworks, each with distinct data inputs, time horizons, and use cases.
Technical Analysis Signals
The most widely used category among retail traders. Technical signals are derived purely from price data and trading volume — the historical record of what the market has done — without reference to underlying economic fundamentals.
Technical signals operate on the principle that historical price patterns and market behavior tend to repeat because human psychology — the fear and greed that drive buying and selling decisions — is consistent over time. When a specific technical condition has reliably preceded upward price movement in the past, its recurrence signals a potential opportunity.
Examples of technical signals:
- A 50-day moving average crossing above the 200-day moving average (the “golden cross”) — a bullish trend signal
- Price breaking above a well-established horizontal resistance level with above-average volume — a breakout signal
- RSI falling below 30 on the daily chart — an oversold signal suggesting potential mean reversion
- A bearish engulfing candlestick pattern forming at a key resistance level — a reversal signal
- Bollinger Band squeeze resolving with a directional breakout — a volatility expansion signal
Fundamental Signals
Fundamental signals are generated by analyzing the underlying economic, financial, or physical supply-demand factors that determine an asset’s intrinsic value. They are typically relevant over longer time horizons than technical signals and are used primarily by position traders, investors, and macro traders.
Examples of fundamental signals:
- A company reporting earnings significantly above consensus estimates — a bullish signal for the stock
- US CPI data printing well above expectations — a bearish signal for bonds, potentially bullish for gold
- OPEC announcing a larger-than-expected production cut — a bullish signal for crude oil
- A currency’s central bank signaling more aggressive rate hikes than markets anticipated — a bullish signal for that currency
- A country’s manufacturing PMI falling below 50 for three consecutive months — a bearish signal for that country’s equity index
Quantitative and Algorithmic Signals
Quantitative signals are generated by mathematical models and computer algorithms that process large datasets — price history, volume, options flow, macroeconomic data, earnings data, and increasingly alternative data sources — to identify statistically significant trading opportunities.
At the retail level, quantitative signals appear as indicator-based strategies coded into platforms like MetaTrader, TradingView Pine Script, or proprietary algorithmic trading platforms. At the institutional level, they involve sophisticated factor models, machine learning algorithms, and high-frequency trading systems processing millions of data points per second.
The defining advantage of algorithmic signals is the removal of human emotional bias from signal generation. The defining limitation is that historical statistical relationships — on which all quantitative models are built — do not always persist into the future, particularly during structural market regime changes.
Sentiment Signals
Sentiment signals measure the collective emotional positioning of market participants — the degree to which traders and investors are collectively bullish or bearish — as a contrarian or confirmatory indicator.
Examples of sentiment signals:
- CFTC Commitments of Traders (COT) Report: When large speculators reach historically extreme net long or short positions in a futures market, a reversal often follows — who is left to push the trend further?
- Put/Call Ratio: High put/call ratios in equity options markets indicate elevated bearish positioning, which can serve as a contrarian buy signal
- VIX levels: Extreme fear readings (VIX above 40) have historically been associated with market bottoms; complacency (VIX below 12) sometimes precedes corrections
- Retail trader positioning data: Some brokers publish aggregated data showing what percentage of their clients are long vs. short on major instruments — contrarian signals can emerge from extreme readings
- News sentiment analysis: AI-driven tools now scan news headlines and social media to quantify market sentiment around specific instruments or macro themes
Common Technical Indicators Used to Generate Signals
Technical indicators are the machinery behind most retail trading signals. Understanding what each indicator actually measures — and what it does not — prevents the misapplication that produces poor results.
| Indicator | Type | What It Measures | Signal Generated |
| Moving Average (MA/EMA) | Trend | Average price over a period; smooths noise | Crossovers, price vs. MA position |
| MACD | Trend/Momentum | Difference between two EMAs vs. signal line | Crossovers, divergence, zero-line crosses |
| RSI (Relative Strength Index) | Momentum | Speed and magnitude of recent price changes | Overbought (>70) / Oversold (<30), divergence |
| Bollinger Bands | Volatility | Price relative to standard deviation bands | Band touches, squeezes, breakouts |
| Stochastic Oscillator | Momentum | Price position within recent high-low range | Overbought/oversold, crossovers |
| Volume | Volume | Quantity of contracts/shares traded | Confirms or questions price moves |
| ATR (Average True Range) | Volatility | Average price range over a period | Stop-loss sizing, volatility context |
| Fibonacci Retracements | Price Structure | Key retracement levels from major moves | Potential support/resistance, entry zones |
| Ichimoku Cloud | Multi-dimensional | Trend, momentum, support/resistance combined | Cloud breaks, Tenkan/Kijun crossovers |
Critical caveat: All technical indicators are derived from past price data. They are lagging by definition — they describe what the market has done, not what it will do. Treating indicator signals as predictive rather than probabilistic is the root cause of much retail trading failure. An RSI reading of 28 does not mean the market will go up. It means the market has been selling off aggressively by recent historical standards, which has historically been associated with eventual mean reversion — a meaningful but far from certain distinction.
Manual vs. Automated Trading Signals
| Factor | Manual Signals | Automated Signals |
| Generation Method | Human analysis — chart reading, research, judgment | Algorithm or rules-based system; no human input |
| Speed | Limited by human processing speed | Instantaneous; can process thousands of instruments simultaneously |
| Emotional Bias | Subject to human emotional influence | Emotionally neutral by design |
| Adaptability | Can incorporate qualitative context, news, nuance | Limited to programmed rules; struggles with novel events |
| Consistency | Variable — depends on analyst discipline and state | Perfectly consistent rule application every time |
| Transparency | Analyst can explain rationale in detail | May be a “black box” if algorithm is proprietary |
| Best For | Swing traders, position traders, macro traders | Day traders, high-frequency strategies, systematic traders |
Neither approach is universally superior. Many professional traders use hybrid systems — automated scanning to identify candidate setups, with manual review and judgment applied to the final entry decision. This combines the speed and consistency of automation with the contextual judgment that human analysis can provide.
Third-Party Signal Services: What to Know Before You Subscribe
The market for paid trading signal services has exploded with the growth of retail trading — and so has the range in quality, from genuinely useful tools to outright fraudulent operations. Understanding this landscape before subscribing to any service is essential.
How signal services work: Signal providers — typically experienced traders, proprietary trading firms, or software companies — generate trade recommendations and distribute them to subscribers via Telegram channels, email alerts, mobile apps, or direct platform integration. Subscribers receive entry, stop-loss, and take-profit levels and are expected to execute the trades in their own accounts.
Red flags that indicate a low-quality or fraudulent signal service:
- Unverifiable performance claims — “95% win rate,” “10x your account in 3 months” with no independently audited track record
- No stop-loss levels provided — a professional signal includes defined risk parameters; omitting them is a significant red flag
- Guaranteed returns — no legitimate signal provider can guarantee returns; this language is a defining characteristic of scam operations
- Pressure to use a specific broker — many fraudulent signal services receive referral commissions from brokers and may have incentives misaligned with your profitability
- No explanation of signal rationale — credible providers explain the basis of each signal; opacity about methodology should prompt skepticism
- Cherry-picked results — showing only winning trades in marketing material without disclosing the full trade history
What legitimate signal services provide:
- A verifiable track record on a third-party platform (MyFXBook for forex signals is the industry standard for independent verification)
- Clear methodology explanation — how signals are generated, what conditions are required
- Full trade history including losing trades and drawdown periods
- Defined risk parameters with every signal
- Transparent risk disclosure
Even the most credible signal service should be used as a learning tool and supplementary input — not as a replacement for your own market understanding and judgment. Blindly following signals without understanding why they are generated produces traders who cannot adapt when conditions change.
How to Evaluate a Trading Signal's Quality
Whether evaluating your own signals or assessing a third-party service, these are the metrics that matter:
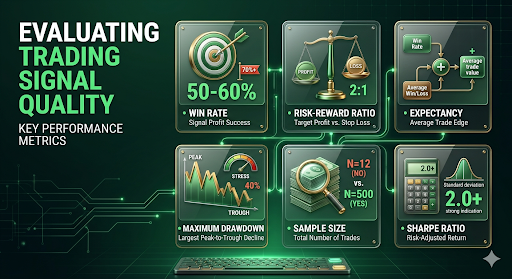
Win Rate The percentage of signals that reach their profit target before their stop loss. A win rate of 50–60% is realistic for most well-designed signal strategies; rates above 70% are unusual and warrant scrutiny unless accompanied by a skewed risk-reward ratio (small wins vs. large losses).
Risk-Reward Ratio The ratio of potential profit to potential loss per signal. A signal targeting 100 pips profit with a 50-pip stop loss has a 2:1 risk-reward ratio. This metric must be evaluated alongside win rate — a 40% win rate strategy with consistent 3:1 risk-reward ratios is profitable; a 70% win rate strategy with 1:2 risk-reward ratios (risking twice what you stand to win) loses money over time.
Expectancy Expectancy combines win rate and risk-reward into a single measure of edge: the average profit or loss per trade, expressed in units of risk. The formula: (Win Rate × Average Win) − (Loss Rate × Average Loss). Positive expectancy means the signal produces profit on average over a large sample; negative expectancy means it loses money regardless of individual winning trades.
Maximum Drawdown The largest peak-to-trough decline in the signal’s equity curve. This reveals the worst historical period of consecutive or overlapping losses — and the psychological and financial stress that a signal strategy has historically required its users to endure before recovering. A signal with a 40% maximum drawdown is practically unusable for most retail traders regardless of its long-term profitability.
Sample Size A signal with 12 trades showing a 75% win rate tells you almost nothing statistically meaningful. A signal with 500 trades showing a 55% win rate is statistically significant. Always evaluate performance over the largest available sample and be deeply skeptical of short track records.
Sharpe Ratio The risk-adjusted return — profit per unit of volatility. A Sharpe ratio above 1.0 is generally considered acceptable; above 2.0 is strong. This metric is more relevant for systematic traders and signal services than for discretionary individual traders.
Signal Confluence: Why One Signal Is Rarely Enough
Professional traders rarely act on a single signal in isolation. The concept of confluence — the alignment of multiple independent signals pointing in the same direction — is one of the most powerful principles in practical trading.
Consider a crude oil trade:
- The daily chart shows price bouncing off a major support level that held twice in the previous year (technical signal: price structure)
- RSI on the daily chart is at 32 and showing bullish divergence (technical signal: momentum)
- The prior week’s EIA inventory report showed a larger-than-expected crude draw (fundamental signal: supply tightening)
- The COT report shows large speculators at historically extreme net short levels (sentiment signal: contrarian)
Each of these signals, in isolation, provides moderate evidence for a long position. Together — four independent signals from different analytical frameworks all pointing the same direction — they constitute a genuinely high-probability setup. The probability is not additive in a simple mathematical sense, but the presence of multiple independent confirming factors meaningfully increases the evidence quality for a trade.
This is why developing the ability to generate signals from multiple frameworks — rather than relying exclusively on one indicator or one signal type — is a defining skill of traders who consistently identify high-quality opportunities.
Trading Signals Across Different Asset Classes
Signal types and their relative effectiveness vary across different markets:
Forex Signals Forex is the most signal-saturated market — and the most populated by dubious third-party signal services. Technical signals work well in the major currency pairs due to their deep liquidity and strong trending behavior. Fundamental signals — central bank policy shifts, inflation differentials, geopolitical developments — drive the larger structural moves that technical signals confirm within.
Equity Index Signals Macro-driven: central bank policy, economic cycle positioning, earnings season trends, and sentiment indicators (VIX) are particularly valuable. Technical signals work well on daily and weekly timeframes for swing positions; intraday signals in index futures are heavily influenced by news flow and institutional order flow.
Commodity Signals Supply-demand fundamental signals are central to commodities — inventory reports, production data, weather forecasts, and geopolitical events often override technical patterns. Technical signals work best when combined with fundamental context; chart-only commodity trading without fundamental awareness is significantly limited.
Cryptocurrency Signals High-volatility environment where sentiment signals (social media momentum, on-chain data, exchange flows) carry more weight than in traditional markets. Technical signals are widely used but frequently prone to false breakouts due to lower liquidity relative to forex and equity markets. Fundamental analysis focuses on protocol metrics, developer activity, and adoption data rather than traditional financial analysis.
Individual Equities Fundamental signals dominate: earnings quality, revenue growth, margin trends, competitive positioning, and sector dynamics. Technical signals are most useful for timing entries and exits around established fundamental theses rather than as standalone trade generators.
How to Build Your Own Trading Signals
Developing your own signals — rather than relying on third-party services — is the most direct route to a trading edge that is genuinely yours, fully understood, and aligned with your specific risk tolerance and time horizon.
Step 1: Identify a Market Behavior You Want to Capture Start with a specific, observable phenomenon: trending moves following breakouts, mean reversion from overbought conditions, price reactions to specific data releases. The more precisely you can define the behavior, the more precisely you can build a signal to identify it.
Step 2: Define the Exact Conditions That Must Be Met Convert your observation into specific, measurable criteria. Not “price is near a support level” but “price is within 0.5% of a level that has been tested at least twice in the previous 90 days with no closes below it.” Vagueness in signal definition produces inconsistent application.
Step 3: Backtest the Signal on Historical Data Apply your signal conditions to historical price data and record the outcomes: how many signals were generated, what percentage reached the profit target, what the average risk-reward was, and what the maximum drawdown was. Backtesting has limitations — particularly the risk of overfitting to historical data that does not represent future conditions — but it provides essential evidence about whether a signal has had any historical merit.
Step 4: Forward Test in Paper Trading After backtesting, apply the signal in real-time paper trading for a minimum of 60 days. This reveals whether the historical edge persists in live market conditions and exposes any execution challenges or ambiguities in your criteria.
Step 5: Track and Refine Record every live signal in your trading journal. Over time, you will identify conditions under which your signal performs strongly and conditions under which it underperforms — allowing targeted refinement that improves edge without overfitting.
The Role of Risk Management in Signal-Based Trading
The most common and costly misunderstanding about trading signals is the belief that a better signal makes risk management less important. The reality is the opposite: risk management is the mechanism that converts a signal’s statistical edge into actual profitability.
Consider two traders using identical signals with a 55% win rate and a 1.5:1 average risk-reward:
- Trader A risks 1% of account per signal consistently
- Trader B risks 5% on “high-confidence” signals and 0.5% on “lower-confidence” ones, based on gut feel in the moment
Over 100 trades, Trader A’s consistent risk management extracts the full statistical edge of the signal. Trader B’s variable sizing means their largest losses (5% risk) frequently coincide with the signal’s inevitable losing trades — wiping out multiple smaller wins and potentially producing overall losses despite using the identical signal.
Non-negotiable risk management rules for signal-based trading:
- Risk a fixed percentage of account equity per signal — typically 0.5–2% for retail traders
- Set the stop-loss level before entering the trade and never move it wider after entry
- Do not override a signal’s defined exit criteria based on emotional conviction that “this one is different”
- Apply daily loss limits: if three consecutive signals fail in a single session, stop trading for the day
- Never increase position size to “make back” losses from previous signals — each signal is an independent probability event
Trading Signals vs. Trading Systems
These terms are related but distinct, and the confusion between them causes practical problems for traders trying to build a coherent approach:
| Aspect | Trading Signal | Trading System |
| Definition | A specific trigger indicating a potential trade opportunity | A complete, rule-based framework for trading — signals, entries, exits, sizing, and risk management |
| Scope | Narrow — answers “is there a trade here?” | Comprehensive — answers every question about how to trade |
| Completeness | Incomplete on its own | Self-contained and executable |
| Example | “RSI crossed below 30 on EUR/USD daily chart” | “Enter long EUR/USD when RSI crosses below 30 on daily chart AND price is at identified support. Stop below support level. Target 2× stop distance. Risk 1% of equity per trade.” |
A signal becomes part of a trading system when it is embedded within defined rules for position sizing, entry execution, stop placement, profit targets, and trade management. Many beginning traders have signals but not systems — they know when to get in but have no pre-defined rules for anything that comes after. This is a structural gap that signals alone cannot fill.
Common Mistakes Traders Make with Signals
Treating signals as certainties Every signal has a failure rate. Building a trading approach that assumes signals will work produces panic and poor decisions when the inevitable losing trades occur. Professional traders expect signals to fail regularly and manage those failures through position sizing and stop-losses — not through better signal selection.
Using too many indicators simultaneously Adding more indicators to a chart in search of confirmation creates analysis paralysis and often generates contradictory signals. Mastering two or three complementary indicators produces better results than monitoring ten that frequently disagree.
Ignoring the broader market context A bullish signal on an individual stock in the middle of a broad market selloff is far lower probability than the same signal during a healthy bull trend. Signal quality is context-dependent. Always evaluate signals within the current macro and market environment.
Chasing signals after missing the entry When a signal triggers and you miss the precise entry level, the temptation is to enter at a significantly worse price to avoid “missing the move.” This habit destroys risk-reward ratios and is one of the most consistent patterns in retail trader loss data. If you miss a signal’s entry, wait for the next one.
Abandoning signals during drawdown Every signal strategy goes through drawdown periods — sustained sequences of losing trades that test the trader’s conviction. The most common response is to stop using the signal exactly when mean reversion toward its historical performance is most likely. Changing signals during drawdown is the behavioral equivalent of selling stocks at the bottom of a crash.
Confusing a high win rate with profitability A signal that wins 80% of trades but loses 4× the average win on the remaining 20% is not profitable — it has negative expectancy. Always evaluate signals on expectancy, not win rate alone.
Conclusion
A trading signal is one of the most fundamental concepts in active trading — and one of the most frequently misunderstood. At its core, a signal is simply evidence: data suggesting that current market conditions resemble conditions that have historically preceded favorable price movement. Nothing more, and critically, nothing less.
The traders who use signals effectively share several characteristics: they understand what their signals actually measure and where they fail; they combine multiple signal types for confluence rather than acting on isolated triggers; they embed signals within complete trading systems with defined risk management rules; and they evaluate signal quality through rigorous metrics — expectancy, drawdown, and sample size — rather than marketing claims or short-term results.
The traders who are hurt by signals — particularly by third-party signal services — are those who treat them as instructions rather than inputs, who follow without understanding, and who abandon risk management in the belief that a sufficiently good signal makes it unnecessary.
Signals are tools. Like any tool, their value is entirely determined by the skill, discipline, and framework of the person using them. Develop that framework first, and signals become a powerful component of a coherent trading approach. Rely on them as a substitute for that framework, and no signal — however sophisticated its origin — will produce consistent results.
Your next step: Take one technical indicator you are currently using or considering — RSI, MACD, a moving average — and spend one hour studying its historical performance on your chosen market. Look specifically for the conditions under which it works reliably and the conditions under which it fails. That one hour of focused analysis will tell you more about how to use that signal effectively than any number of generic trading courses.
FAQs
Are free trading signals reliable?
Free signals vary as much as paid ones — some are genuinely useful educational tools or community-generated alerts with transparent track records; others are marketing tools designed to funnel traders toward specific brokers. The price tag (or lack of one) tells you nothing about quality. Apply the same evaluation criteria — verifiable track record, defined risk parameters, transparent methodology — to free signals as to paid ones.
Can trading signals be used for long-term investing?
Yes, though the terminology differs. Long-term investors often use fundamental signals — valuation metrics, earnings trends, macroeconomic cycle indicators — to time entries and exits over months or years. The concept is identical to short-term signal trading; only the data inputs and timeframes change.
Do professional traders use trading signals?
Yes, though the form varies enormously. Institutional quantitative traders use highly sophisticated algorithmic signals. Discretionary macro traders use a blend of fundamental and sentiment signals. Even traders who describe themselves as "pure discretionary" are effectively using informal signals — pattern recognition frameworks that have been internalized through experience. The label "signal" is sometimes avoided by professionals who prefer terms like "setup," "trigger," or "catalyst," but the underlying concept is the same.
What is the difference between a signal and an alert?
A signal is an analytical output indicating a potential trading opportunity with defined parameters. An alert is a notification mechanism — a price level hit, an indicator threshold crossed, a news headline flagged — that prompts the trader to investigate whether a signal is forming. Alerts bring situations to your attention; signals tell you what to do about them.
How many signals should I follow at once?
For most retail traders — particularly those still developing their approach — following signals on one to three instruments simultaneously is the practical limit for maintaining quality execution and emotional discipline. Spreading attention across too many signals simultaneously increases the probability of execution errors and reduces the quality of trade management on each position.
Can AI generate reliable trading signals?
AI and machine learning systems can identify complex non-linear patterns in market data that traditional indicators miss, and their application in institutional trading is growing rapidly. At the retail level, AI-based signal tools are available but require the same evaluation criteria as any other signal source — verified track record, defined risk parameters, realistic performance expectations. AI signals are not categorically superior to well-designed rule-based approaches; they carry their own risks, including overfitting and poor performance during regime changes that were not present in training data.