What Are Indices in Trading?
An index in trading is a numerical representation of the performance of a basket of assets — selected and weighted according to a defined methodology — used to track the health of a market, sector, or asset class at a glance. Rather than analyzing hundreds of individual stocks, a single index number tells you whether the collective value of those stocks rose or fell, and by how much.
Think of the S&P 500 as the most prominent example. It measures the combined market performance of 500 of the largest publicly listed companies in the United States. When you hear that “the market was up 1.2% today,” the speaker is almost certainly referring to a major index — not any individual stock. Indices are, in this sense, the language through which market participants communicate the state of the market.
For traders specifically, indices are not just informational tools — they are tradeable instruments in their own right. Through the financial products built around them, a trader can go long (profit if the index rises) or short (profit if the index falls) on an entire market with a single position. This makes indices one of the most versatile and widely used instruments in global financial markets, accessible to everyone from retail day traders to trillion-dollar institutional funds.
A Brief History of Market Indices
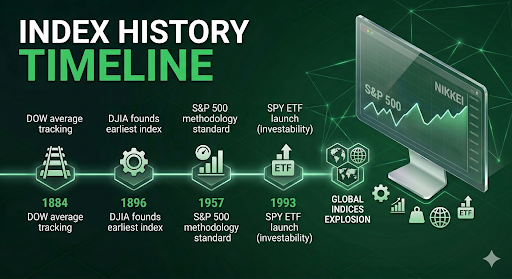
The concept of tracking the collective performance of a group of stocks dates back to 1884, when Charles Dow — co-founder of Dow Jones & Company and the Wall Street Journal — began calculating an average of eleven major American stocks, most of them railroads. This evolved into the Dow Jones Industrial Average (DJIA) in 1896, which tracked twelve industrial companies and is now the oldest surviving stock market index in the world.
The S&P 500 followed in 1957, introduced by Standard & Poor’s as a more representative measure of the US economy. Unlike the price-weighted DJIA, the S&P 500 used market capitalization weighting — a more statistically robust methodology that would become the industry standard.
The subsequent decades brought indices to every major economy. The FTSE 100 launched in London in 1984, the DAX in Frankfurt in 1988, and the Nikkei 225 in Tokyo had been tracked since 1950. The explosion of index-linked financial products in the 1990s and 2000s — particularly ETFs following the launch of the SPDR S&P 500 ETF (SPY) in 1993 — transformed indices from reference tools into the investable asset class they are today.
Today, there are estimated to be over three million indices globally, covering everything from the broadest equity markets to the narrowest thematic niches such as clean energy, cybersecurity, or dividend aristocrats.
How Are Indices Constructed?
Not all indices are built the same way. The construction methodology determines how much influence each constituent has on the index level — and understanding this is essential for interpreting index movements correctly.
Market Capitalization Weighting
The most common methodology. Each company’s influence on the index is proportional to its total market capitalization (share price × total shares outstanding). Larger companies move the index more than smaller ones.
Example: In the S&P 500, Apple, Microsoft, and NVIDIA together have historically accounted for more than 15–20% of the entire index weight. A 5% move in these stocks can shift the index significantly even if most of the other 497 stocks barely moved.
Implication for traders: Cap-weighted indices are heavily influenced by a small number of mega-cap names. Understanding what is happening with the top 10 holdings often explains the majority of index movement.
Price Weighting
In a price-weighted index, companies with higher share prices have greater influence regardless of their total market value. The Dow Jones Industrial Average is the most famous example.
Example: A stock trading at $400 per share influences the DJIA four times more than a stock trading at $100 — even if the $100 stock represents a far larger company by market cap. This methodology is considered less representative of economic reality, which is why the DJIA has largely ceded its role as the primary market benchmark to the S&P 500.
Equal Weighting
Every constituent has an identical weight in the index, regardless of size. Equal-weighted indices give small-cap companies the same influence as large-caps. The S&P 500 Equal Weight Index (RSP) is a widely followed equal-weighted alternative to the standard S&P 500.
Implication for traders: Equal-weighted indices tend to outperform cap-weighted versions during periods when small and mid-cap stocks lead the market, and underperform when mega-caps dominate — as was the case through much of the 2020s US bull market.
| Methodology | Example Index | Key Characteristic |
| Market Cap Weighted | S&P 500, NASDAQ 100, FTSE 100 | Dominated by largest companies |
| Price Weighted | Dow Jones Industrial Average, Nikkei 225 | High-priced stocks dominate |
| Equal Weighted | S&P 500 Equal Weight (RSP) | Every constituent equally influential |
| Float-Adjusted Cap Weighted | MSCI World, Russell 2000 | Only freely tradable shares counted |
| Fundamental Weighted | FTSE RAFI Indices | Weighted by revenue, earnings, dividends |
The Most Important Indices in Global Markets
US Indices
The United States equity markets produce the world’s most closely watched indices. They function as the global risk barometer — when US indices fall sharply, markets worldwide typically follow.
S&P 500 (SPX) The gold standard of market benchmarks. Tracks 500 large-cap US companies across 11 sectors, selected by the S&P Index Committee. Covers approximately 80% of available US market capitalization. Every serious investor globally watches the S&P 500 as the primary measure of US equity market health.
NASDAQ 100 (NDX) Tracks the 100 largest non-financial companies listed on the NASDAQ exchange. Heavily weighted toward technology — Apple, Microsoft, NVIDIA, Amazon, Meta, and Alphabet together typically represent 40%+ of the index. The NASDAQ 100 is the benchmark for technology sector performance and tends to exhibit higher volatility than the S&P 500.
Dow Jones Industrial Average (DJIA) The oldest and most iconic index, tracking just 30 large, blue-chip US companies. Despite its fame, its price-weighting methodology and narrow constituent list make it less representative than the S&P 500 as a market measure. It remains widely quoted in mainstream media and retains strong symbolic significance.
Russell 2000 (RUT) Tracks 2,000 small-cap US companies. It is the primary benchmark for small-cap US equities and is closely watched as an indicator of domestic US economic conditions, since small-cap companies generate more of their revenue domestically than large multinationals.
European Indices
FTSE 100 (UK) Tracks the 100 largest companies listed on the London Stock Exchange. Notably international in character — many FTSE 100 constituents (including mining companies, energy majors, and pharmaceuticals) generate the majority of their revenues outside the UK. The FTSE 100 is denominated in GBP and is sensitive to sterling movements.
DAX 40 (Germany) Germany’s primary benchmark, tracking 40 major Frankfurt-listed companies. Unique among major indices in that it is a total return index — it includes dividend reinvestment in the calculation, making direct comparisons with price-return indices like the S&P 500 potentially misleading. The DAX is highly exposed to manufacturing, automotive, and industrial sectors.
CAC 40 (France) Tracks 40 large-cap companies listed on Euronext Paris. Dominated by luxury goods, energy, and financial sectors — LVMH and TotalEnergies are typically among the heaviest-weighted constituents.
Euro Stoxx 50 A pan-European index tracking the 50 largest companies across Eurozone member countries. Functions as the primary benchmark for the broader European equity market.
Asian and Global Indices
Nikkei 225 (Japan) Japan’s most recognized index, tracking 225 Tokyo Stock Exchange-listed companies using price weighting. Export-heavy — the Nikkei is highly sensitive to JPY exchange rate movements, since Japanese exporters’ earnings are significantly impacted by the yen’s strength or weakness.
Hang Seng (Hong Kong) Tracks major companies listed on the Hong Kong Stock Exchange. Historically a key gateway to Chinese equity exposure for global investors, though its composition and sentiment drivers have evolved significantly with increased mainland Chinese representation and geopolitical developments.
CSI 300 (China) Tracks the top 300 A-share companies listed on the Shanghai and Shenzhen exchanges. The primary benchmark for mainland Chinese equities.
MSCI World / MSCI Emerging Markets Constructed by MSCI, these indices are not exchange-listed in the traditional sense but serve as critical benchmarks for global institutional investors. The MSCI World covers large and mid-cap equities across 23 developed market countries; the MSCI EM covers 24 emerging market economies.
How Do You Trade an Index?
Since you cannot buy or sell an index directly, traders access index exposure through several financial instruments — each with different characteristics suited to different trading styles and objectives.
Index Futures
Futures contracts on indices are among the most liquid and actively traded instruments in global markets. They are standardized agreements to buy or sell the index at a fixed price on a specified future date. Futures trade nearly 24 hours a day, making them the primary vehicle for institutional index trading and for reacting to news outside regular exchange hours.
Key index futures contracts:
| Contract | Exchange | Index | Contract Size (approx.) |
| E-mini S&P 500 (ES) | CME | S&P 500 | $50 × index level |
| Micro E-mini S&P 500 (MES) | CME | S&P 500 | $5 × index level |
| E-mini NASDAQ 100 (NQ) | CME | NASDAQ 100 | $20 × index level |
| E-mini Dow (YM) | CME | DJIA | $5 × index level |
| FTSE 100 Futures | ICE | FTSE 100 | £10 per index point |
| DAX Futures | Eurex | DAX 40 | €25 per index point |
The Micro E-mini contracts (MES, MNQ) were introduced specifically to make futures accessible to retail traders with smaller account sizes — the margin requirement for a single MES contract is a fraction of the full E-mini.
ETFs and Index Funds
Exchange-Traded Funds that track indices are the most accessible entry point for retail investors. They trade on stock exchanges exactly like individual shares and require no futures account or margin management.
Major index ETFs:
| ETF | Index Tracked | Exchange |
| SPY / IVV / VOO | S&P 500 | NYSE/NASDAQ |
| QQQ | NASDAQ 100 | NASDAQ |
| DIA | Dow Jones Industrial Average | NYSE |
| IWM | Russell 2000 | NYSE |
| EWU | FTSE 100 (GBP-hedged) | NYSE |
| EWG | DAX / Germany | NYSE |
ETFs are ideal for longer-term investors and those who want index exposure without leverage. However, they do not allow short-selling through a standard account and cannot be traded outside normal exchange hours.
CFDs on Indices
Contracts for Difference (CFDs) on indices allow retail traders to speculate on index price movements with leverage — without owning the underlying futures or shares. CFD index trading is available on platforms like IG, CMC Markets, and most retail forex brokers.
CFDs offer several practical advantages for active traders: fractional position sizing, the ability to go long or short with equal ease, and access to index markets globally from a single account. However, CFDs are OTC instruments and carry counterparty risk — and leverage amplifies both gains and losses. CFDs are not available to retail traders in the United States, where they are not regulated.
Options on Indices
Index options (such as SPX options, which are among the most heavily traded derivatives in the world) give traders the right but not the obligation to buy or sell an index at a specified level by a specific date. They are widely used for hedging equity portfolios, generating income through covered strategies, and defined-risk speculation.
Index options are cash-settled — there is no delivery of shares. Options add a layer of complexity (including the management of delta, gamma, theta, and volatility exposure) that makes them better suited to experienced traders who understand options mechanics.
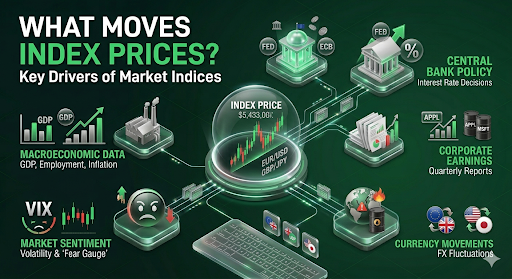
What Moves Index Prices?
Index prices reflect the collective valuation of their constituent companies — but numerous macro and market forces drive those valuations:
Macroeconomic Data GDP growth figures, employment reports (particularly the US Non-Farm Payroll), inflation readings (CPI, PCE), and retail sales data all directly influence index direction by shaping expectations for corporate earnings and central bank policy.
Central Bank Policy Interest rate decisions from the Federal Reserve, European Central Bank, Bank of England, and Bank of Japan are among the most powerful single catalysts for index movement. Lower interest rates reduce the discount rate applied to future earnings, boosting equity valuations. Rate hikes compress valuations — the 2022 global equity selloff was driven largely by the fastest Fed rate hiking cycle in decades.
Corporate Earnings In cap-weighted indices, the quarterly earnings reports of the largest constituents carry outsized influence. An earnings miss from Apple or Microsoft can drag the S&P 500 and NASDAQ 100 significantly, even if the rest of the market is flat.
Geopolitical Events Wars, sanctions, elections, and diplomatic crises inject uncertainty into markets, typically triggering selloffs as risk appetite contracts. The 2022 Russia-Ukraine invasion caused immediate sharp declines in European indices and energy price spikes with global ripple effects.
Market Sentiment and Risk Appetite Indices are not purely mathematical constructs — they reflect collective human psychology. The VIX (Volatility Index, often called the “fear gauge”) measures implied volatility in S&P 500 options and is closely watched as a real-time indicator of market anxiety. When the VIX spikes, indices typically fall; when VIX is low and stable, markets tend to drift higher.
Currency Movements For internationally-exposed indices like the FTSE 100 and Nikkei 225, currency fluctuations materially impact index performance. A strengthening yen compresses Japanese export earnings; a weaker pound inflates the sterling-reported revenues of FTSE 100 multinationals.
Indices vs. Individual Stocks: Key Differences
| Factor | Index Trading | Individual Stock Trading |
| Diversification | Built-in — exposure to dozens or hundreds of companies | Concentrated — single company risk |
| Volatility | Generally lower (diversification dampens swings) | Higher — earnings, news, CEO changes can cause 10–30% gaps |
| Overnight / Event Risk | Reduced but not eliminated | High — one earnings release can gap a stock significantly |
| Fundamental Analysis | Macro-focused: GDP, rates, sentiment | Company-focused: balance sheet, management, sector |
| Liquidity | Extremely high in major indices | Varies widely — small-caps can be illiquid |
| Leverage Available | High (futures, CFDs) | Moderate (margin accounts) |
| Short Selling | Simple via futures, CFDs | Requires stock borrow; can be costly or unavailable |
| Accessible Hours | Near 24-hour (futures) | Exchange hours only |
The fundamental advantage of index trading over individual stocks is diversification. A single company can go to zero — Enron, Lehman Brothers, and Wirecard are cautionary reminders that even seemingly robust businesses can collapse entirely. An index cannot go to zero; its worst realistic outcome is a severe and extended drawdown from which it historically recovers.
Sector Indices and Thematic Indices
Beyond broad market indices, there is a rich ecosystem of specialized indices that allow traders and investors to express targeted views:
Sector Indices divide the market by industry classification. The S&P 500 is broken into 11 GICS sectors, each with its own index and ETF:
| Sector | Example ETF | Characteristics |
| Technology (XLK) | XLK | Growth-oriented, high P/E, rate-sensitive |
| Energy (XLE) | XLE | Correlated with oil prices, cyclical |
| Financials (XLF) | XLF | Rate-sensitive, economically cyclical |
| Healthcare (XLV) | XLV | Defensive, less cyclical |
| Utilities (XLU) | XLU | Highly defensive, dividend-focused |
| Consumer Discretionary (XLY) | XLY | Economically sensitive, retail/auto heavy |
Volatility Indices — The VIX (CBOE Volatility Index) measures the market’s expectation of 30-day S&P 500 volatility derived from options pricing. It is tradeable through futures and ETFs (though not without complexity). The VIX tends to spike during market stress and decay during calm periods.
Thematic Indices track specialized investment themes: clean energy (ICLN), cybersecurity (HACK), artificial intelligence (AIQ), genomics (ARKG), and hundreds of others. These serve investors who want concentrated exposure to a structural investment theme without selecting individual stocks.
Index Trading Strategies
- Trend Following on Daily/Weekly Timeframes Major indices spend significant periods trending in one direction, driven by economic cycles and monetary policy regimes. Swing traders and position traders use moving averages, trendline breaks, and momentum indicators to capture these multi-week or multi-month directional moves. The 2020–2021 bull market and the 2022 bear market were both sustained trends that rewarded disciplined trend-followers.
- Mean Reversion / Range Trading During periods of economic stability and low volatility, indices often oscillate within defined ranges. Mean reversion traders buy pullbacks to key support levels and sell rallies to resistance, using indicators like RSI and Bollinger Bands to identify overextended conditions. This strategy is particularly effective with the S&P 500 during low-VIX environments.
- Index Arbitrage and Calendar Spreads Sophisticated traders exploit price discrepancies between an index’s futures and its constituent stocks, or between different futures delivery months. This requires speed, infrastructure, and significant capital — primarily the domain of institutional and algorithmic traders.
- Macro/Event-Driven Trading Trading indices around scheduled macro events — Fed meeting decisions, Non-Farm Payroll releases, CPI prints — requires understanding how the actual data compares to consensus expectations and how the market is positioned heading into the release. The initial reaction is often violent and can reverse quickly, making risk management critical.
- Sector Rotation Rather than trading a single index, sector rotation strategies allocate between sector indices based on the phase of the economic cycle. Historically, financials and industrials lead early in economic recoveries; technology and consumer discretionary perform well in mid-cycle expansions; utilities and healthcare tend to outperform in late-cycle slowdowns.
- Hedging with Indices Portfolio managers and equity traders routinely use index futures or put options to hedge long stock portfolios during periods of elevated uncertainty. Selling S&P 500 futures against a long portfolio of US equities reduces net market exposure without requiring the liquidation of individual stock positions.
Risks of Trading Indices
Indices are often marketed as “safer” than individual stocks because of diversification. This is partially true — but index trading carries its own significant risks:
Systematic Market Risk Diversification eliminates company-specific risk but not market risk. During broad selloffs — the 2008 financial crisis, the 2020 COVID crash — virtually all stocks fell simultaneously, and indices dropped 30–50%+ in months. Diversification within an index provides no protection against these systematic events.
Leverage Risk Index futures and CFDs involve significant leverage. A 1% move in the S&P 500 can represent a 10–20% gain or loss on a leveraged position. Leverage amplifies both directions and can cause account blow-ups in fast-moving, volatile market conditions.
Concentration Risk in Cap-Weighted Indices The top-heavy nature of cap-weighted indices like the S&P 500 and NASDAQ 100 means that the “diversification” they offer is less complete than it appears. When a handful of mega-cap technology stocks are under pressure, the index suffers disproportionately — as was demonstrated in 2022 when the NASDAQ 100 fell over 30%.
Roll Costs for Futures Traders Futures contracts expire and must be rolled to the next delivery month. In normal market conditions this cost is modest, but in periods of extreme volatility or steep futures curves, roll costs can become significant.
Gap Risk Major indices can gap significantly at the open following overnight news — geopolitical events, central bank announcements, or major economic data releases outside trading hours. Stop-loss orders do not guarantee execution at the specified price during a gap.
How to Read an Index Quote
Understanding an index quote requires familiarity with the specific numbers and terminology used across trading platforms:
Example: S&P 500 Index Quote
| Field | Value | Meaning |
| Price / Level | 5,482.50 | Current index level (points) |
| Change | 38.2 | Points gained since previous close |
| % Change | 0.007 | Percentage gained since previous close |
| High | 5,495.30 | Highest level during current session |
| Low | 5,450.10 | Lowest level during current session |
| Open | 5,460.40 | Level at session open |
| Previous Close | 5,444.30 | Closing level of prior session |
| 52-Week High/Low | 5,669.67 / 4,835.04 | Annual range context |
Points vs. Percentage: Media coverage often expresses index changes in points (“the Dow fell 400 points today”), but percentage change is the more meaningful metric for comparison. A 400-point fall in a Dow at 40,000 is 1% — the same as a 54-point fall in an S&P 500 at 5,400.
Pre-market and after-hours levels: S&P 500 and NASDAQ futures trade nearly around the clock and are widely quoted as indicators of where the cash index is likely to open. “S&P futures are pointing to a 0.5% lower open” means the E-mini S&P 500 futures are currently trading approximately 0.5% below the previous regular session close.
Conclusion
Indices are the backbone of global financial markets — the universal language through which traders, investors, economists, and media communicate the state of the world’s economies at any given moment. Understanding what they are, how they are built, what drives them, and how to trade them is not optional knowledge for a serious market participant. It is foundational.
Whether you are an equity investor benchmarking your portfolio against the S&P 500, a day trader scalping the E-mini futures during the New York open, or a macro trader expressing a view on European economic weakness through a short DAX position — you are working within the framework that indices define.
The key principles to carry forward are these: indices measure collective performance, not individual company outcomes; construction methodology determines whose performance matters most within an index; the instruments you use to trade them (futures, ETFs, CFDs, options) carry different costs, risks, and suitability profiles; and the forces that move them — monetary policy, economic data, earnings, and sentiment — operate on a global, interconnected stage.
Your next step: Choose one major index to follow closely for 30 days. Track its daily moves, identify what news is driving it, and begin recognizing the relationship between macro events and price action. Fluency in reading one index well is far more valuable than a surface-level familiarity with many.
Frequently Asked Questions
1. What is the difference between an index and an ETF?
An index is a mathematical calculation — a number that represents the performance of its constituent assets. It is not a tradeable security. An ETF (Exchange-Traded Fund) is an actual investable product that holds the constituent securities of an index and aims to replicate its performance. When you “invest in the S&P 500,” you are typically buying an ETF like SPY or VOO, not the index itself.
2. Can you short an index?
Yes. Through futures contracts, CFDs, and inverse ETFs, traders can take short positions that profit when an index falls in value. Options strategies (such as buying put options) also provide leveraged short exposure with defined maximum loss.
3. Which index is the best indicator of the overall US stock market?
The S&P 500 is the most widely accepted benchmark for the US equity market, covering approximately 80% of total US market capitalization across all major sectors. The Wilshire 5000 Total Market Index technically covers the broadest range of US stocks, but the S&P 500 is the standard professional reference.
4. Why do different indices sometimes move in different directions?
Indices track different baskets of stocks with different sector exposures, geographic focuses, and company-size profiles. The NASDAQ 100 and Russell 2000 can move in opposite directions if large-cap technology is rallying while small-cap domestic companies are struggling — which occurs, for example, when the US dollar is strengthening (good for tech’s international revenues, bad for domestically-focused small-caps).
5. Are indices adjusted for dividends?
It depends on the index type. Price return indices (like the S&P 500 standard version) measure only price changes and do not include dividends. Total return indices (like the DAX 40 and the S&P 500 Total Return Index) include dividends reinvested, providing a more complete picture of overall investor returns. This distinction matters significantly when comparing index performance over long periods.
6. What does it mean when an index is "rebalanced"?
Index rebalancing refers to the periodic process of reviewing and adjusting the constituent companies and their weights. Companies may be added (when they meet inclusion criteria) or removed (due to declining market cap, delistings, or sector reclassification). Major S&P 500 rebalancing events can cause significant trading volume in the added and removed stocks as index funds adjust their holdings.